


Web Performance Optimization: Essential Tips, Metrics And Our Success Story
Web performance optimization is an approach that measures how long a site takes to load, how the user perceives it (through user experience metrics), and how smooth its content “acts” during user interactions. In this article, we will give you a detailed guide on all relevant web performance terms and optimization tips, including some aspects of technical SEO and Google’s Core Web Vitals.
So, how to improve website performance? Let’s find out together.
About Web Performance & Core Web Vitals
Web performance is tightly associated with, but not limited to, website speed. It indeed calculates the time that a website takes to load in an interactive and responsive manner. However, it also measures the overall smoothness and behavior of content from the user’s perspective, including scrolling, behavior of pop-ups and buttons, responsiveness and so on. In that sense, web performance refers to objective measurements, such as time to load, and subjective experiences, such as how long it has felt like as the content was loaded to the users, as pointed out by Mozilla experts.
Core Web Vitals, on the other hand, are a set of metrics that Google formed as a standard to help developers understand how a visitor experiences a web page. Even though Core Web Vitals were created mainly for developers, its bundled tools can help all site owners, as they dissect the user’s integrated experience on a website and its pages, and provide solutions to improve them.
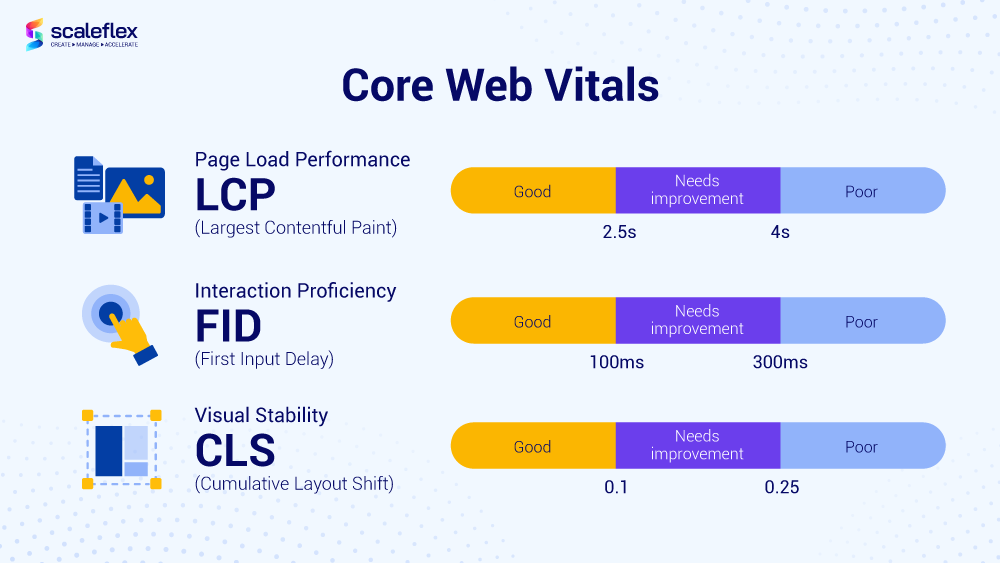
Since technical SEO refers to addressing the requirements of modern search engines, Core Web Vitals should be part of your website performance optimization agenda. These metrics will help you identify user experience by evaluating page load performance, interaction proficiency, and visual stability of a page as seen from the user’s angle.
The three main metrics are:
- Largest Contentful Paint (LCP), focused on measuring user experience based on the render time of the largest blocks visible to visitors. This metric is only focused on how quickly content sections render on the visible screen.
- Cumulative Layout Shift (CLS), focused on identifying links and buttons that shift once a page has loaded. It is connected to the level of ease or difficulty the user experiences when engaging with the website, once a page renders.
- First Input Delay (FID), is focused on measuring the so-called input latency, or the time a page takes to respond from a user’s input. Thanks to this metric, you can identify the pages that may baffle your site’s visitors.
What is Web Performance Optimization?
Web performance optimization is aimed at making websites run fast or even faster. Even in some cases when a fewprocesses are seemingly slow, there are web performance tips and tricks that should make them feel faster.
As we already pointed out, web performance can be described as the combination of objective measurement and subjective (perceived) user experience of a website (or an application). Web performance is the theory of it all, whereas optimization is the act of putting what you have learned into practice. This modern-day field of knowledge deals with areas such as reducing overall load time, lazy loading, smoothness and interactivity, perceived performance, and web performance metrics.
Key Web Performance Metrics
So, what are some of the most crucial website performance metrics that you need to cover in your website SEO plan (in order to improve your website performance)?
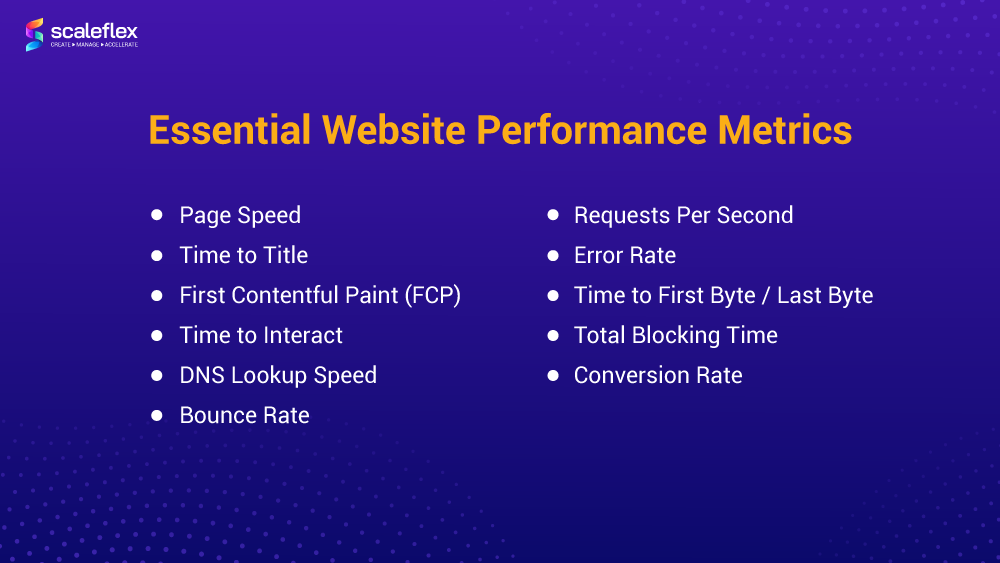
Page Speed
Page speed is a top-of-mind metric that estimates how fast the content on a page loads. It should be noted that this metric is different from site speed, which is how quickly a browser can load web pages while browsing your site. Page speed is interconnected with “loading time” and “time to first byte” on a specific page. The latter term measures the time the browser needs to receive the first byte of information from the server.
One go-to way to quantify the page speed of your website is via Google’s PageSpeed Insights.
Time to Title
As the name suggests, this is another web performance, time measurement metric, referring to the amount of time from a user’s website request to the moment the site title shows up on the browser tab. The faster it loads, the more legitimate and trustworthy your site appears to your audience.
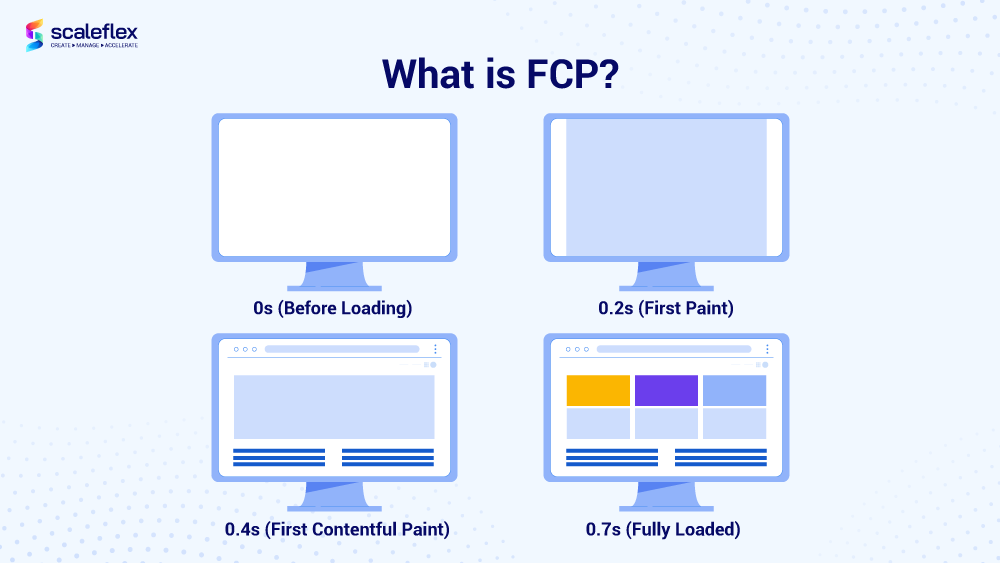
First Contentful Paint (FCP)
This web performance metric measures the time from the moment the page starts loading to when any part of its content is rendered on the screen. In this specific case, “content” means text, images (including background ones), 'svg' elements, and non-white 'canvas' elements.
Time to Interact
The “time to interact” metric measures the most critical moment in a page load, or the moment the primary interactive of page content is shown to the user interactively. It is an important metric for measuring user experience.
DNS Lookup Speed
DNS Lookup Speed, or DNS Lookup time, is the time a DNS (Domain Name Server) needs to receive the request for the IP address of a domain name, process it, and then return it to the browser. It has been estimated that the average DNS lookup time is between 20 and 120 milliseconds.
Bounce Rate
Bounce rate is all about the percentage of visitors that come to your site and then leave, rather than staying and continuing to view more of its pages. This metric is calculated by counting the number of single-page visits and dividing that number by total visits. Page speed and bounce rate are in mutual reception, as the faster the page loads, the more likely it is for the user to stay and view more pages.
Requests Per Second
RPS weighs the number of requests received in a specified monitoring period, usually in a range from one to five minutes. Request counts are made without analyzing what the request involves. Requests can be anything from getting a URL from a web server to database queries and fetching emails. The basic principles of the “requests per second” metrics remain the same.
Error Rate
Error rate tracks the percentage of request issues your website encounters, in relation to the total number of requests. This performance metric should be monitored regularly, because the number of errors may increase without you noticing it, which will probably create a bigger problem to deal with.
Time to First Byte/Last Byte
Time to First Byte is the time between the browser requesting a page and receiving the first byte of information from the server. TTFB includes DNS lookup and establishes the connection via a TCP and SSL handshake, in case the request has been made over HTTPS. In other words, this metric is about the time needed between the start of the request and the start of the response, measured in milliseconds.
Time to Last Byte (TTLB), on the other hand, calculates the delay between the request sent by the browser and the receiving of the last byte of the related response. It is only logical that TTLB follows the TTFB metric.
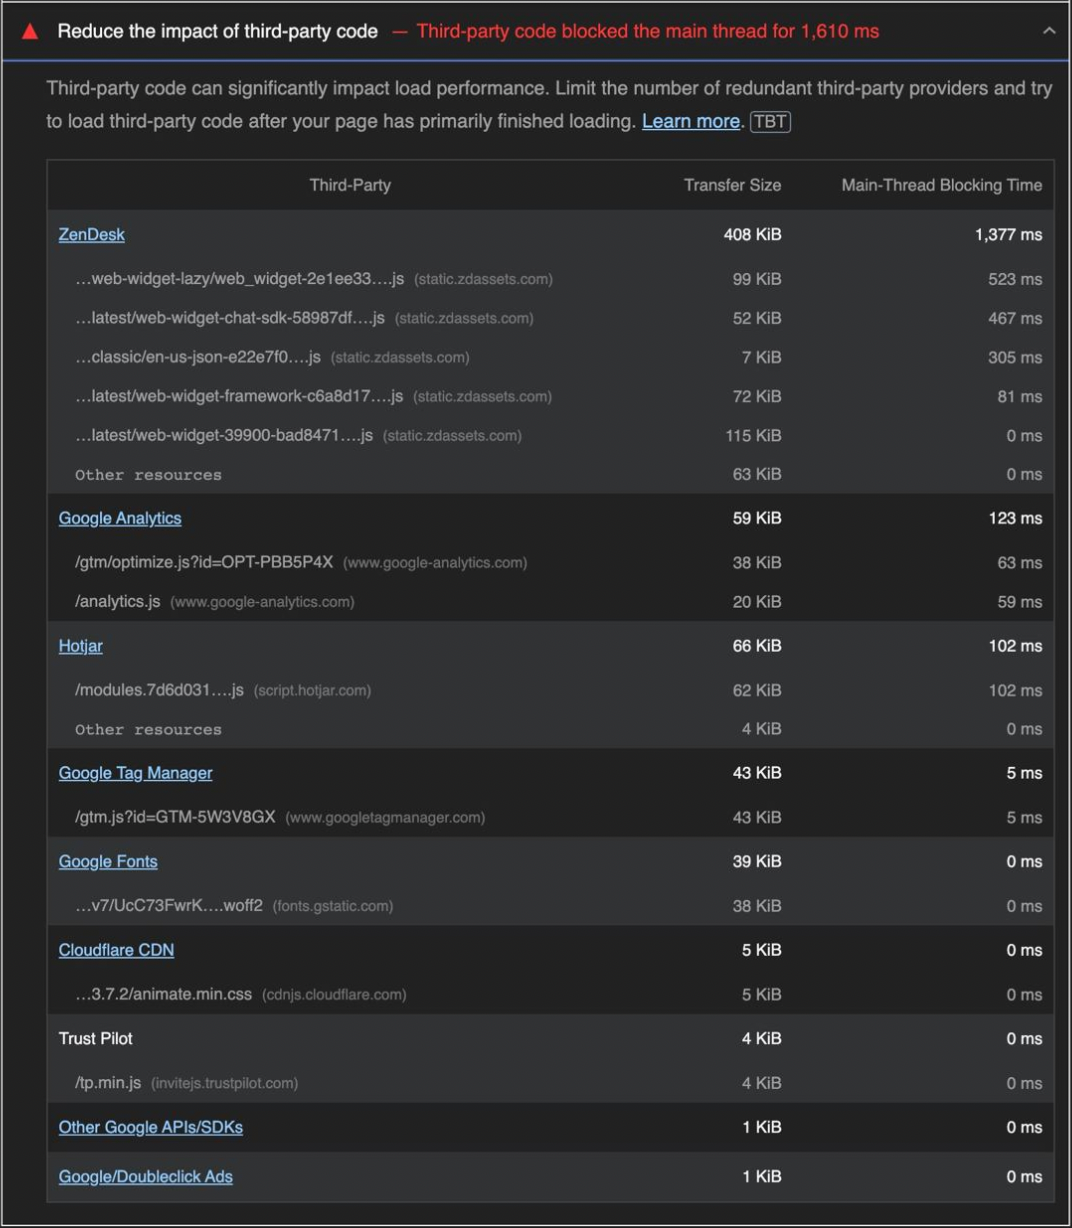
Total Blocking time
Total Blocking Time refers to the total amount of time between First Contentful Paint and Time to Interact metrics, during which the so-called Long Tasks (longer than 50ms) block the main threat, affecting the page usability. Why “blocked”? Because the browser can’t intercept a task in progress, if the user interacts with the page in the middle of a long task, the browser must wait for the task to end before it responds. In case of a long task (above 50ms), the user may easily notice the delay and perceive the page as slow.
Conversion Rate
Shortly said, the conversion rate is made up of the number of all conversions divided by the total number of visitors. We should highlight that web performance does affect conversion rate. More specifically, page speed and conversion rate can be considered being “in a relationship”. In a nutshell, faster page speed will lead to more conversions with which, a better conversion rate will follow.
Return to the Table of ContentsWeb Performance Optimization Tips
The sole purpose of this article is to show you that website performance is critical. Here are some of the most essential tips to help you make your website perform better.
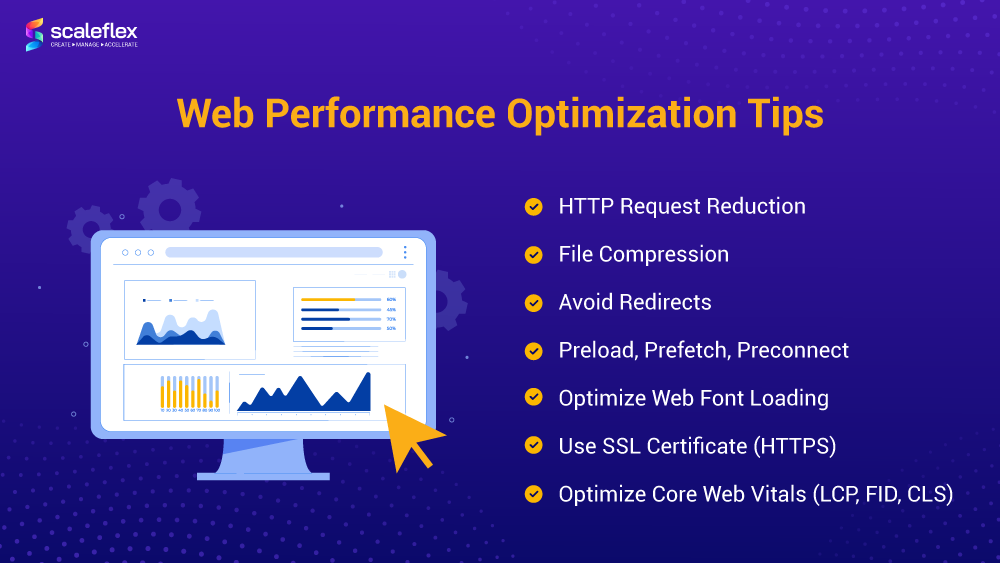
HTTP Request Reduction
When a browser fetches data, it uses HTTP (Hypertext Transfer Protocol). The more HTTP requests your web page makes, the slower it will load. You can fix that by:
- Inlining your JavaScript and using CSS Sprites;
- Reducing the number of third party assets, such as plugins that tend to make many external requests,
- Avoiding the use of third-party frameworks, and combining your CSS and JavaScript files.
File Compression
Web pages are getting more and more complex, as is their code, and subsequently, their load time. By implementing file compression, you can significantly reduce code files, thus improving your website speed and responsiveness.
Avoid Redirects
Redirects for web performance are needed and used for many reasons, but they should be avoided as much as possible. Redirects generate the so-called additional round trip time. They also tend to increase the time needed to load the initial HTML document, even before the browser starts loading other assets. That’s why some webmasters call them “performance killers.”
But if redirects are needed, you’ll need an efficient way to track and maintain them as part of your web performance optimization strategy. Redirection management tools can help you to automate and streamline this process.
Preload, Prefetch, and Preconnect
These resource hints allow web developers to revamp the delivery of resources, reduce round trips, and fetch resources to distribute content more efficiently in real-time. Preload is a relatively new web standard that allows for better management of how specific resources are fetched. Prefetch is a low priority resource hint that enables the browser to fetch resources in the background and store them in its cache. Preconnect is another resource hint that makes it possible for the browser to set up early connections prior to an HTTP request sent to the server.
Optimize Web Font Loading
In fact, this topic alone is quite complex, and there are various ways to improve the delivery of fonts. The way you decide to do this should depend on your web hosting preferences and server, your website design, and even your own technical skills. Keep in mind that some web fonts, such as Google Fonts, add extra HTTP requests to external resources. Choose your fonts based on browser support, and only use the styles you need.
Use SSL Certificate (HTTPS)
Do we need to say that Google penalizes websites that haven’t implemented an SSL certificate? They will still be indexed, but chances to appear in highly ranked positions are negligible.
Core Web Vitals Optimization Tips
Let’s look for the guide of how to improve Core Web Vitals tactics below.
Optimize LCP
Google says that your LCP score should be within the first 2.5 seconds of the loading page. Poor LCP results are usually caused by slow server response time, render-blocking JavaScript and CSS, slow resource load time, and client-side rendering.
In order to get a good LCP result, aim at optimizing the above-mentioned factors. Some tips include optimizing your images, caching your images to improve delivery time, and using a CDN solution.
Optimize CLS
What is a good CLS score? For fully static pages, it could be as low as 0. The more layout shifts occur on the page, the higher the score will be. Of course, you should aim at a lower score, because it will mean that your layout is stable. Google’s performance tools define that a good CLS result is below 0.1, and a poor one is above 0.25.
Some of the most common root causes for poor CLS performance include images without dimensions, as well as ads, embeds and iframes without dimensions; dynamically injected content; web fonts causing a flash of invisible text and flash of unstyled text issues, and actions waiting for a network response before updating the DOM.
You can fix these issues by using font:display values and rel=preload, as well as including width and height elements for videos and images.
Optimize FID
First, we should mention that the FID metric is measured in milliseconds, and it is described as a user metric. You should aim at keeping your FID score under 100ms. You can improve your score by improving your CSS and JavaScript code.
Return to the Table of ContentsHow Cloudimage Improved Its Web Performance in March 2022
Reading about optimization is much different than actually doing it. To show you that achieving a good optimization score is possible, we decided to share with you one of our own success stories, or how we substantially improved the performance of Cloudimage.io.
For measuring page quality, we used Web.dev, and for page performance - PageSpeed Insights.
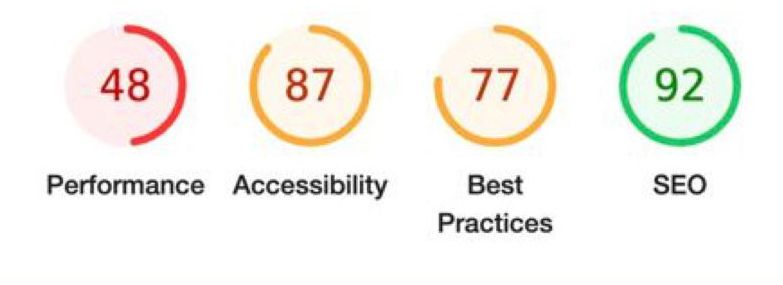
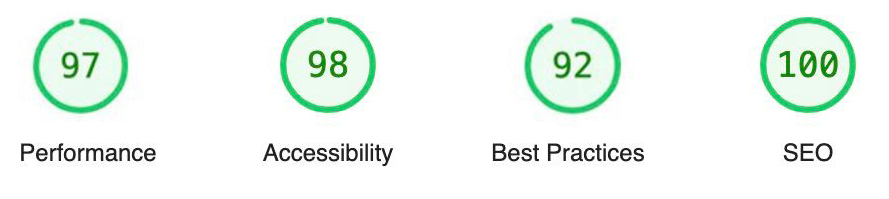
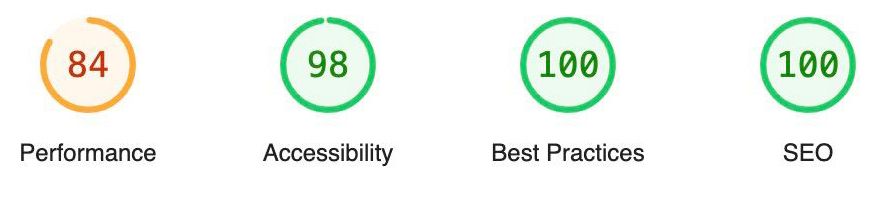
Desktop scores (before optimization):
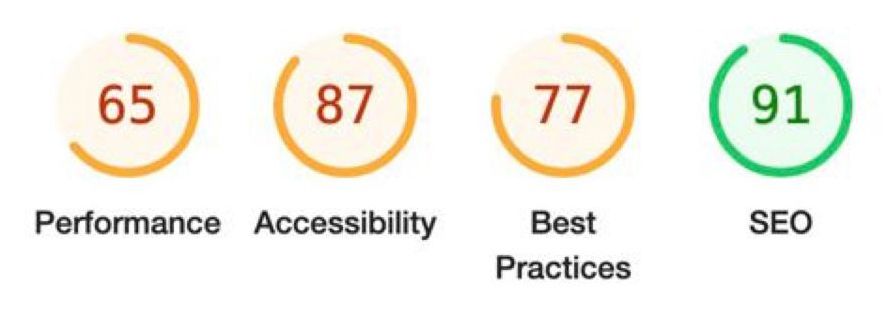
Mobile scores (before optimization):
What We Did and What We Discovered While Doing It
1. We optimized our images.
The very first thing we did was using Cloudimage to optimize and deliver the images on the website. Of course, you can use any other available trustworthy, supportive Image CDN service.
2. We fixed a Cookie consent script issue.
Then, we checked whether there were any scripts that impaired web performance. This is how we discovered that the Cookie consent script uses javascript:void(0) instead of event.preventDefault(). Note that javascript:void(0) violates Content Security Policy on CSP-enabled HTTPS pages. We proceeded with updating the script to the latest version. This action alone got us an +9 SEO desktop score.
Another tip regarding Cookie consent is avoiding links in the Cookie consent text, as they can also include javascript:void(0). If you discover that the latest version of Cookie consent also uses javascript:void(0), then we advise you to contact the support and ask them to fix it, or simply search for another Cookie consent plugin.
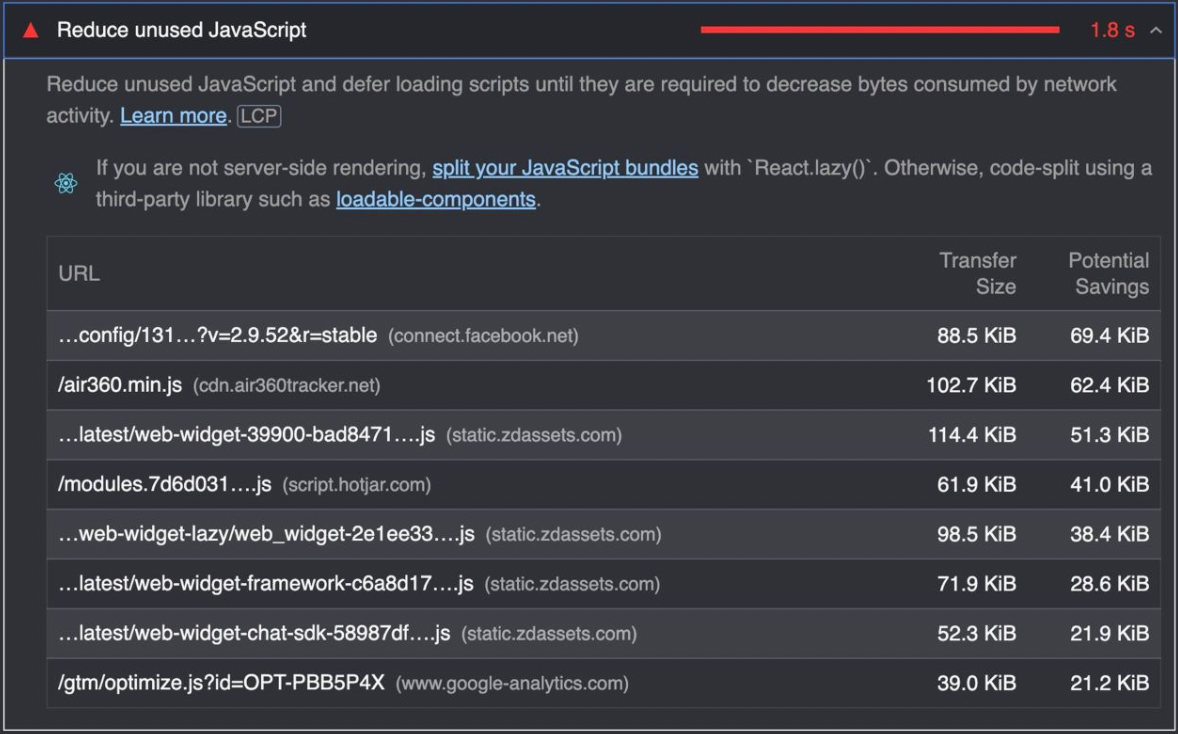
3. We optimized our scripts.
The next step in our optimization plan included improving heavy scripts, or scripts that have a negative impact on page loading time. This also meant checking for unused JavaScript, such as leftover scripts from various tools or hard-coded ones. We removed all the scripts that we didn’t need anymore. Even though this action may be irrelevant for the Core Web Vitals score in this specific case, remember that everything that needs to be lazy-loaded should be loaded asynchronously.
4. We checked the impact of our support chatbots.
Even though chatbots are generally user-friendly and useful, they may slow down your website. The solution we implemented is applying the lazy-loading trick for full loading after just 3 seconds.
5. We added dispatch events for CSS.js libraries.
For CSS.js libraries, we added dispatch events when they are loaded. However, you should be careful with this action, as it is not available for all browsers. In our case, we didn’t need to optimize for Internet Explorer, which meant a lower risk level.
These steps significantly improved our performance results in a single month, proving that consistency pays off big scores:
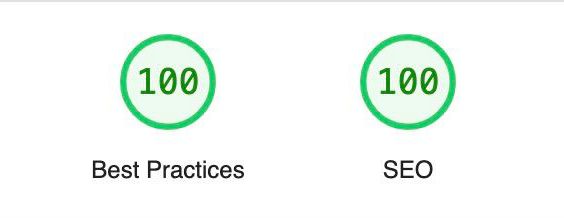
Desktop score (after optimization):
Mobile score (after optimization):
Note: mobile version mostly scores worse than desktop in tests, but there is no reason to worry about it; two main factors are responsible for this: mobile devices have slower processors in general and audits are executed with a slow 3G connection.
Conclusion
There are many actions and tips you can take to improve web performance. In this article, we provided a detailed overview of what we believe are most important, including our own success story of Cloudimage. If you have not got good scores by testing your web performance, speak to a developer (or your development team) and figure out together how it can be improved.
In fact, Cloudimage alone can help you do the first critical step to improve your web performance by providing image optimization and image acceleration. This will give a significant boost to your website performance and will spare you enough time to optimize the rest.
FAQs
Why is web performance optimization important?
If you want your website to be competitive and perform well for your audience to keep coming back to it, then you need to optimize it. Website performance optimization, however, is not a one-time and one-night result task. It is a continuous process that requires your full attention, patience and dedication.
How to measure website performance?
You can evaluate your website performance by following the top website performance metrics we listed in this article. They include page speed, time to the title, FCP, time to interact, DNS lookup time, bounce rate, requests per second, error rate, TTFB/TTLB, total blocking time, and conversion rate.
What are the 5 key web performance indicators?
Some say that the five most important performance indicators are page speed, Time to Title, First Contentful Paint (FCP), Time to Interact and DNS lookup speed. Of course, the answer may vary, but these are definitely cornerstones in excellent website performance.
How do Core Web Vitals affect SEO?
Google’s Core Web Vitals metrics help you understand how your audience experience your website. They give you specific, measurable data which you can use to improve your site. Simply put, the better the results, the better experience you will provide, and the more Google will like your site.
Return to the Table of Contents

