50 Visual Content Marketing Statistics: Trends, Challenges and Solutions
Vying for the attention of 4.14 billion users using social networking sites out of the 4.66 billion on the Internet is an uphill challenge for marketers.
In 2022, providing fantastic and informative textual content alone is insufficient to grab readers’ interest. Instead, the only way for your product, content, or service to stand out in the sea of information on the Internet today is to provide a combination of text and outstanding, original visual content that is difficult for others to duplicate or imitate.
Stay on top of today’s content challenges with our list of crucial visual marketing statistics that demonstrate the value of images, visuals, infographics, and videos in instilling message association, enhancing user engagement, improving brand relevance, and increasing market performance.
The Growing Importance of Visuals
Why are visuals so essential in the marketing world today? That’s because visual content piques viewers’ interests and compels them to connect with the topic more deeply and meaningfully. Visuals are considerably more entertaining to look at than a large chunk of text, and they have the power to draw people in like a magnet.
For this reason, visual content outperforms boring, repetitive, text-only content in terms of traffic, likes, follows, customers, engagement, visit duration, information retention and subsequently, revenue.
Read the following statistics, which can help you better understand this:
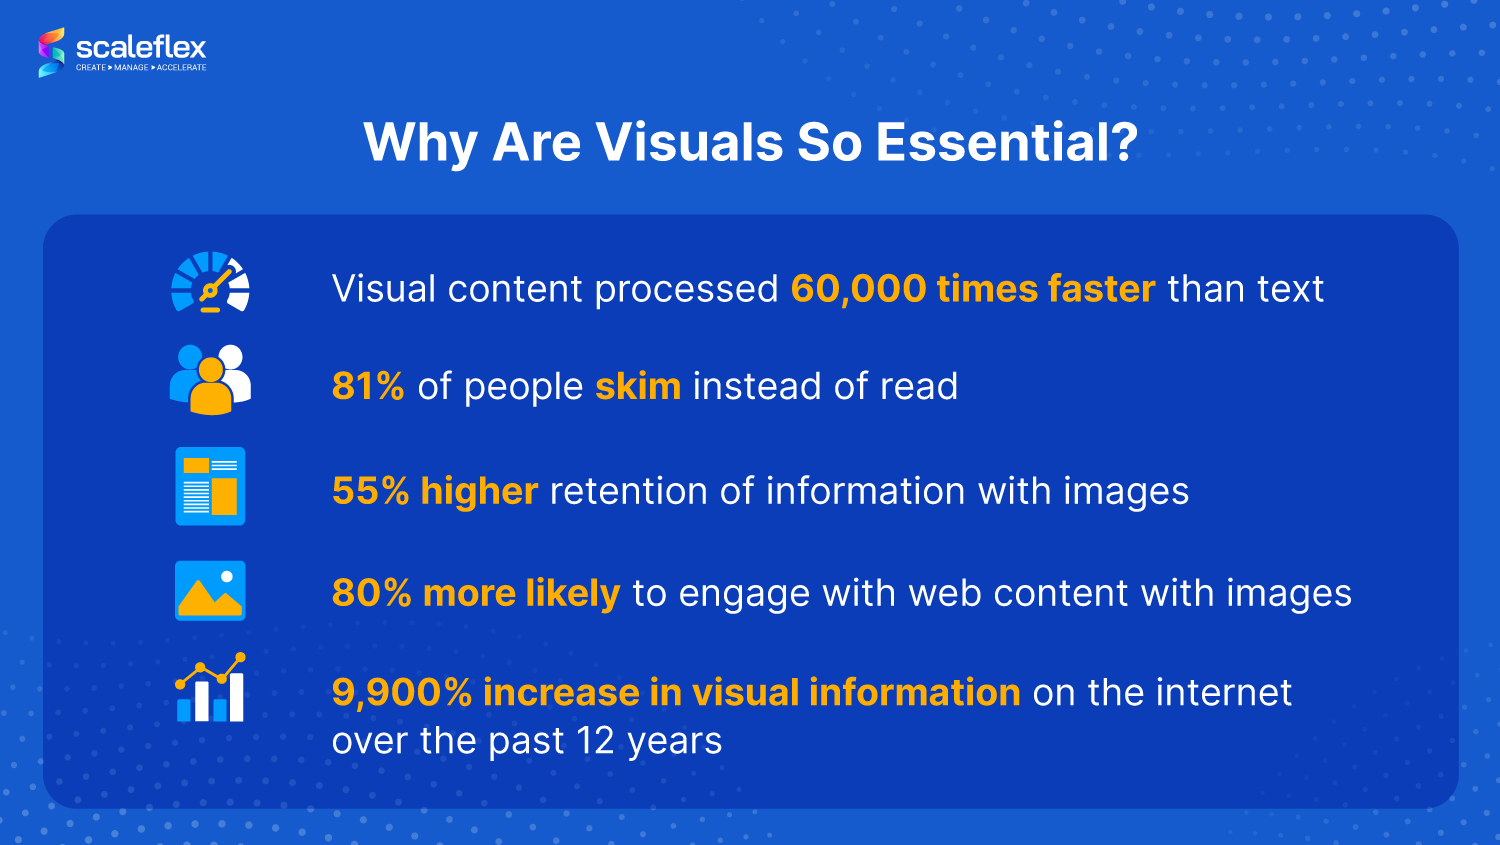
1. Humans are highly visual, and can process visual content 60,000 times faster than text. - Search Engine Journal
2. 81% of educated people skim through content online instead of reading - Nicholas Carr, The Shallows
3. When presented with an image, people retain 55% more information - Brain Rules
4. With meaningful images, users are 80% more likely to engage with web content - The Next Scoop
5. 9,900% increase in visual information on the internet since 2007 - Inkfactory
The first impression counts!
First impressions apply even on the web. You have just a small window to capture the attention of your prospective customers, so you absolutely can’t mess it up!
6. People form their first impression of a web page in just 50 milliseconds - American Psychological Association
7. The first 5 seconds of your page load time has the highest on your conversion rates - Portent
Quality content matters
Marketers already know the importance of relevant text content, but how about images, videos, and infographics? Here’s a look at what marketers do in terms of publishing visual content:
8. 70% of companies invest in content marketing, including visual marketing strategies - Hubspot
9. 40.8% of marketers publish visual content between 2 to 5 times every week - Venngage
10. Images topped the chart for most used visual content (80%) for marketing campaigns, followed by videos (63%) - Social Media Examiner
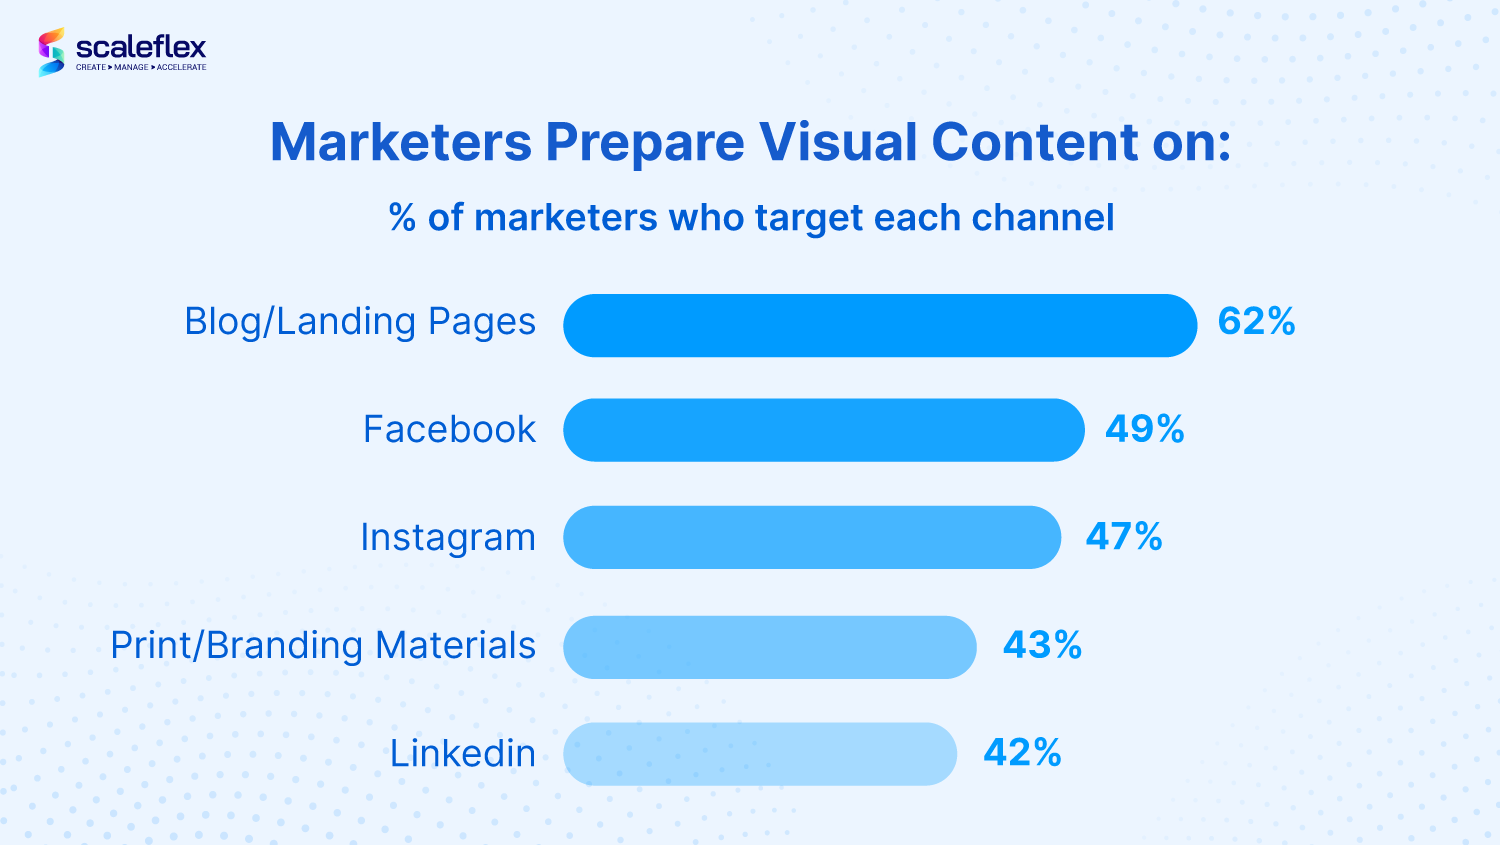
11. Marketers are creating visual content primarily for website landing pages and blogs (62%), followed by social media sites like Facebook (49%) and Instagram (47%) - Venngage
12. 84% of consumers say that watching promotional videos have influenced their decision to purchase a product or service - Wyzowl
13. 49% faster growth in revenue for marketers who utilize videos as part of their content strategy - Forbes
14. 56% of marketers used visuals in all of their published articles - Impact+
The rising trend of visual search
E-commerce marketers and businesses should also not forget visual search trends that will impact the retail industry. Shoppers are generally thrilled to use visual search as a way to aid their retail experiences, such as Google Lens and Pinterest.
15. 69% of young shoppers prefer to buy products through visual-oriented searches - Website Planet
16. By 2023, the visual search market worldwide will surpass $14,727 million - Industry Arch
17. 30% increase in digital commerce revenues for websites that support visual search - Gartner
18. Pinterest’s Lens registers more than 600 million visual searches every month - VentureBeat
Images and Videos Visual Statistics
There are so many different types of visual content. We’ll cover a bit of all of them in this article, starting with the use of images and videos - the most used ones on the Internet.
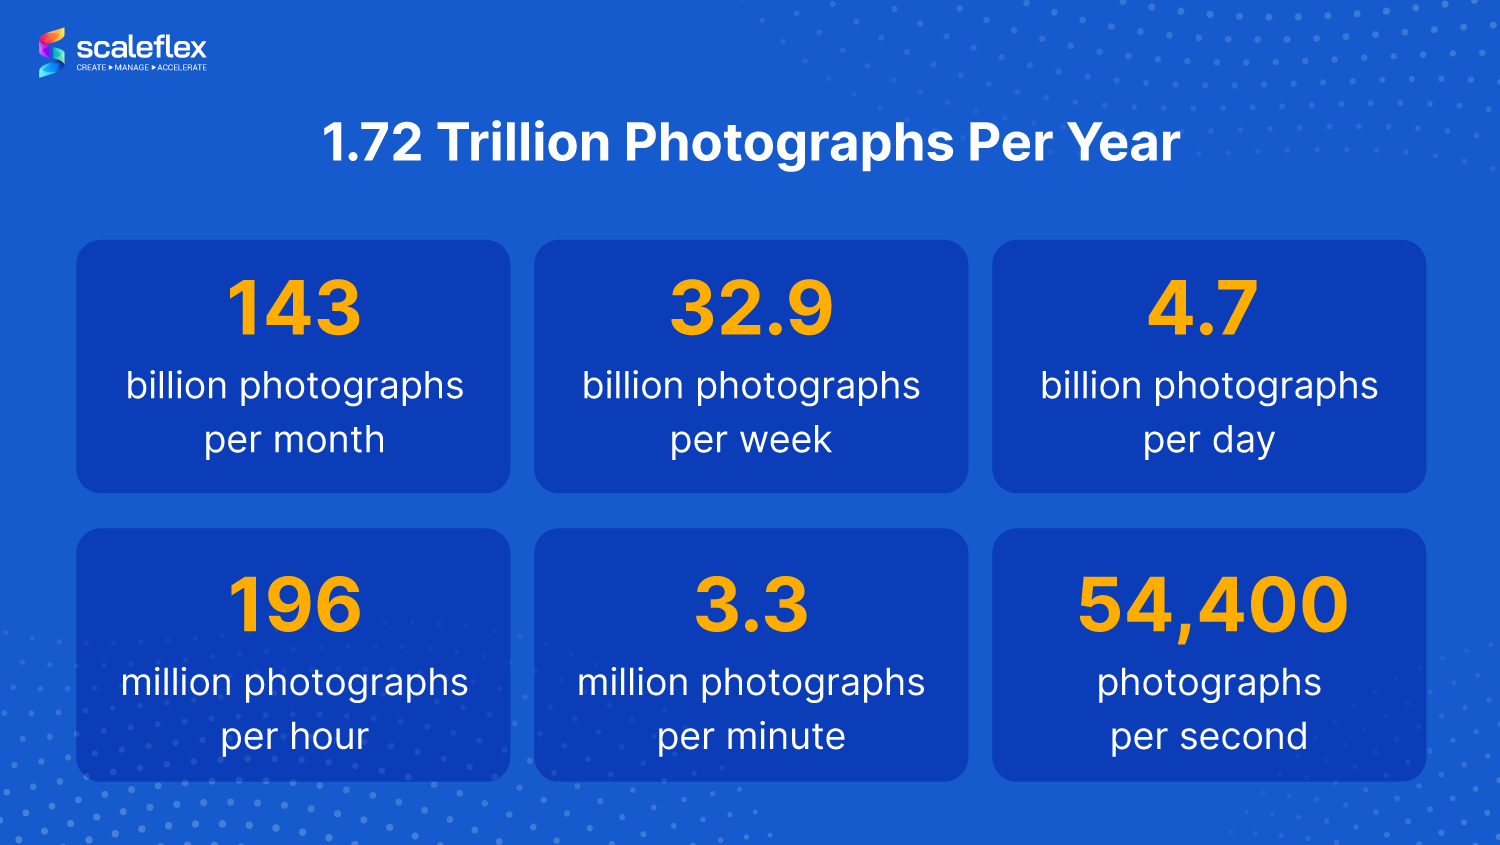
19. 1.72 trillion photographs are taken annually around the world - Phototutorial
20. Articles with an image after every 75 - 100 words receive double the number of shares compared to those without - BuzzSumo
21. People watched 12.2 billion minutes of video in 2021 - HubSpot
22. Every second, 1 million minutes of video content passes through the Internet - Finances Online
23. 93% of companies had a new customer after publishing a video on social media - Cision PR Newswire
24. Videos rank first in the form of content marketers want to learn more about - Social Media Examiner
25. Videos improve email campaigns by 500%, increasing both click-through rates and conversions - Wordstream
26. Videos will make up 82% of all consumer internet traffic by 2022 - Cisco
27. Video streaming platforms have increased significantly in the past few years. Live-streaming platform, Twitch, saw year-over-year growth of 14.3% in 2020 with up to 1.645 billion watch hours each month - The Verge
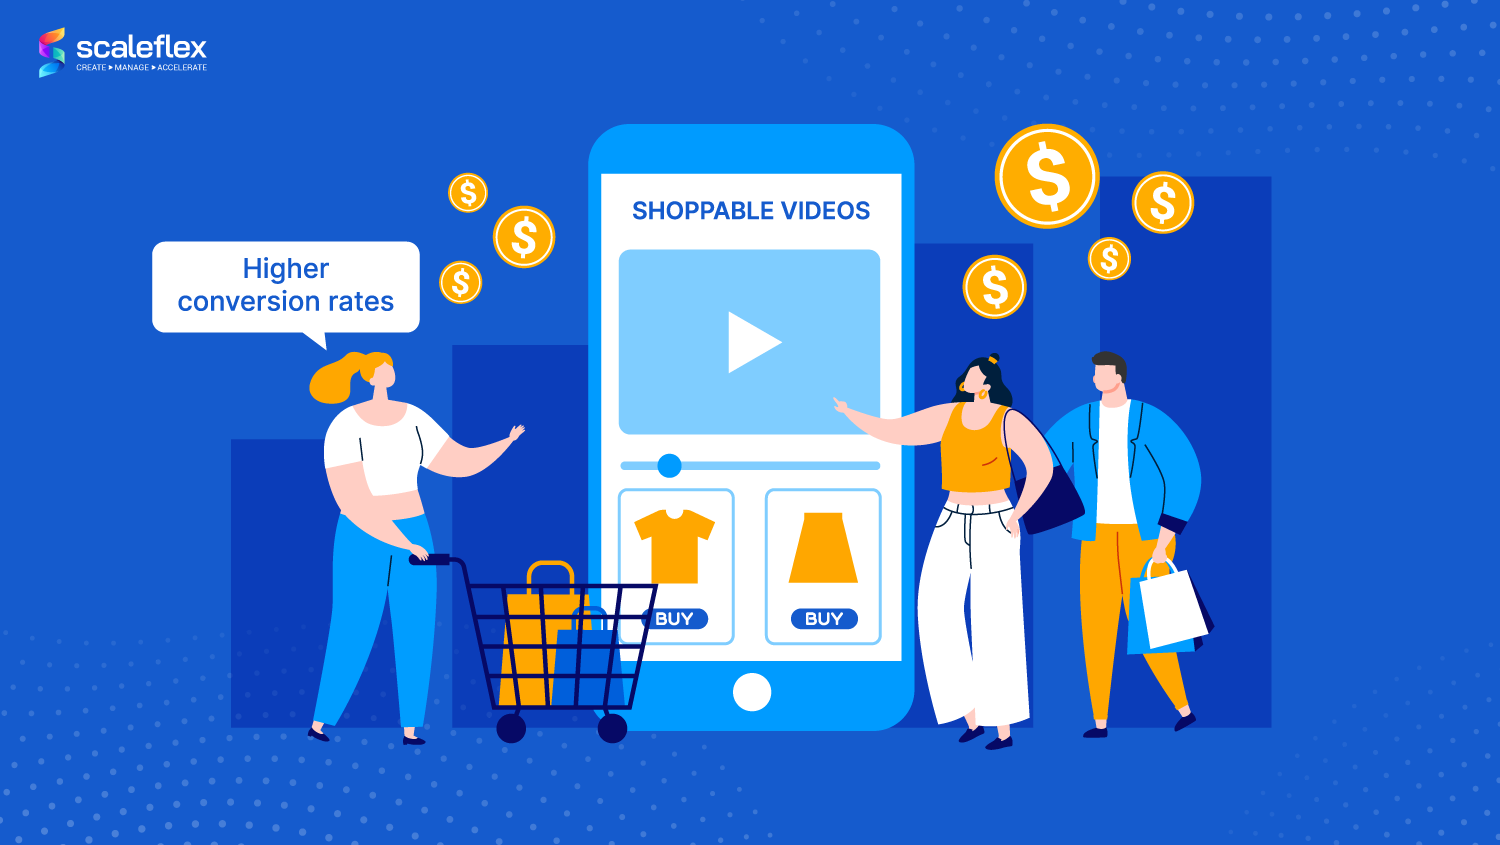
28. Shoppable videos are starting to display higher conversion rates as compared to display ads - Think with Google
Videos that allow users to click straight into the product pages help increase shopping cart conversion for businesses as it shortens the click-funnel between the ad and the checkout page.
Visual Content on Social Media Platforms
Social media is a platform for visual communication where images, videos and infographics play a major role in grabbing the reader’s attention, improving the shareability of posts, and communicating brand-related information.
29. That’s why 80% of marketers use images in every social media post - Foap
Other statistics include:
30. More than 500 million Instagram accounts use Stories every day, and 4 million businesses use ads on Stories monthly - Instagram Business
31. Tweets that include videos receive 10 times more engagement - X Business
32. There are more than 8 billion video views on X daily - Digiday
33. Facebook posts with images receive 2.3 times more engagement - BuzzSumo
34. 15% of all Facebook content is video, and the optimal length for best engagement is 2 to 5 minutes - Sociainsider
35. Advertisers reach more than 169 million people on Pinterest - Hootsuite
36. 88% of Pinterest users have bought a product they pinned - Yahoo News

37. An estimated 70% of users go on YouTube to find help for their problems - Think With Google
Rather than search “How-tos” via a Google Search query, users now also go on YouTube to find solutions to their problems. For marketers, informative videos and guides can be highly effective marketing content.
38. 50% of YouTube subscribers between 18 and 34 years old would drop everything they were doing just to watch a new video from their favorite channel - Think With Google
39. YouTube Shorts garnered 6.5 billion daily views in March - Tech Genyz
40. Linkedin posts containing 8 images perform the best - Okdork
Business-to-business marketers should use this statistic to their advantage to connect with other brands and decision-makers. Linkedin accounts for 46% of social traffic to B2B sites and content is often seen as more trustworthy than those from other social media sites.
41. The number of marketers using TikTok doubled in 2020, and it has the second-highest consumer spend of all mobile applications - WeAreSocial
TikTok, a platform that runs short-form video content, started in 2016 by ByteDance, skyrocketed to fame at the start of the Coronavirus pandemic. This platform has over 1 billion monthly active users, of which 500 million came from India, 180 million from China, and 130 million from the US.
42. Short-form video content, with ads as short as 15 seconds, will continue to grow in popularity - Hubspot
Live Videos: New forms of visual content
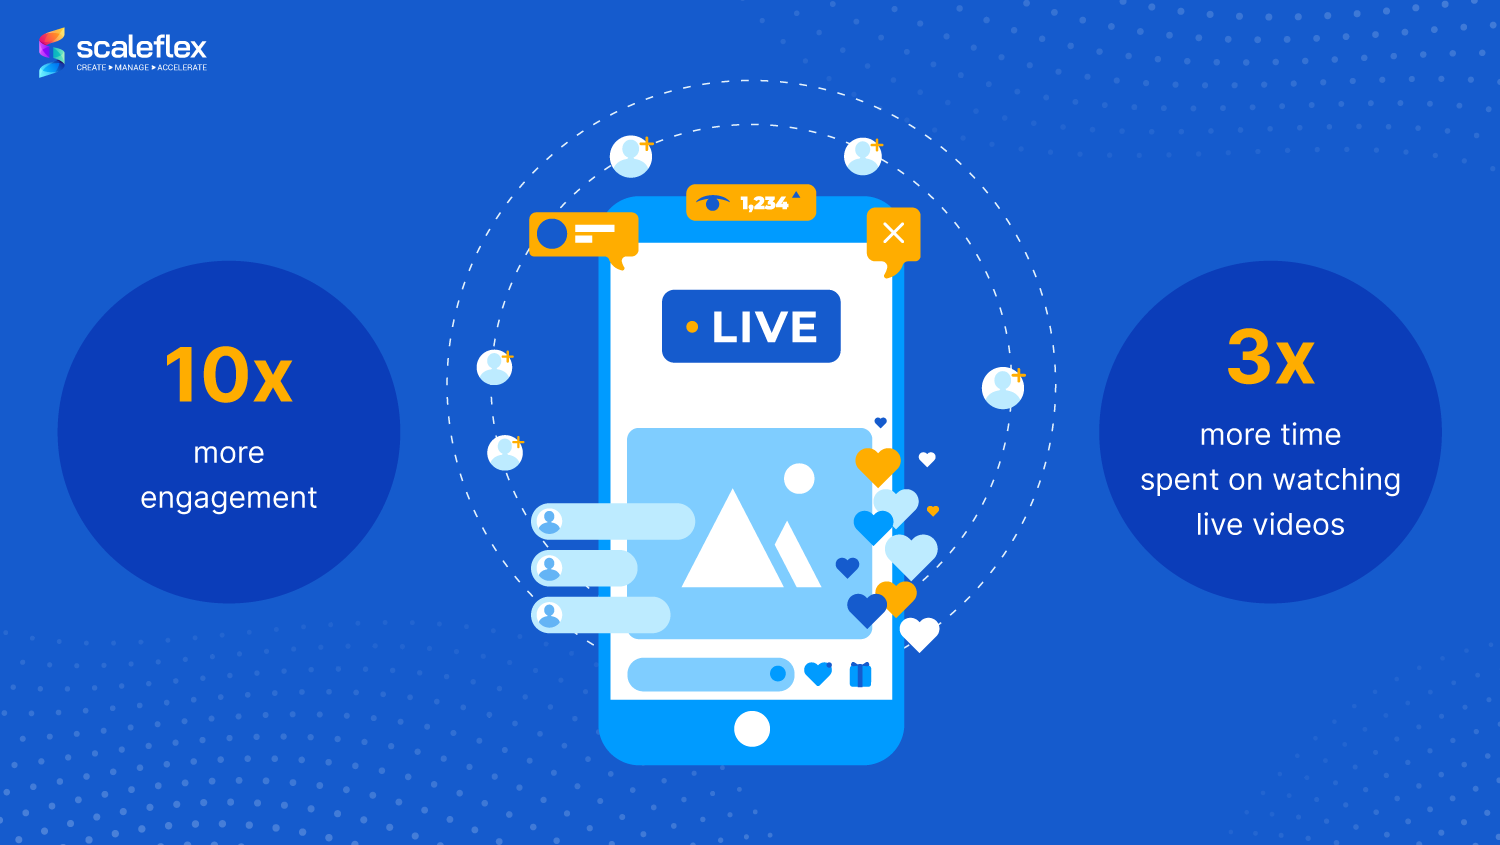
43. People spend 3 times longer watching live videos than regular videos on Facebook, and live videos drive 10 times more engagement - Facebook Newsroom
Another booming trend is the rise of live videos. These videos that happen in real-time are extremely popular with consumers and commands longer watch times with higher engagement rates.
Live videos present an interesting way to communicate information with online users. Travel bloggers can take their followers onto the streets as they walk around a new city, while e-commerce and marketplaces can use live shopping to provide time-limited deals.
44. 64% of marketers stated that Facebook Live will be the most popular live channel for visual marketing in 2021, and 19% chose Instagram Live - Social Media Examiner
45. Twitch daily viewership grew 14.3% in 2020 as compared to 2019 - TwitchTracker
Challenges of Visual Content Marketing
That said, visual content can be challenging to create, manage and publish. Not only more time and specialized knowledge are needed, but marketers still have to consider the need for speed on online sites.
Creation of high-quality visuals
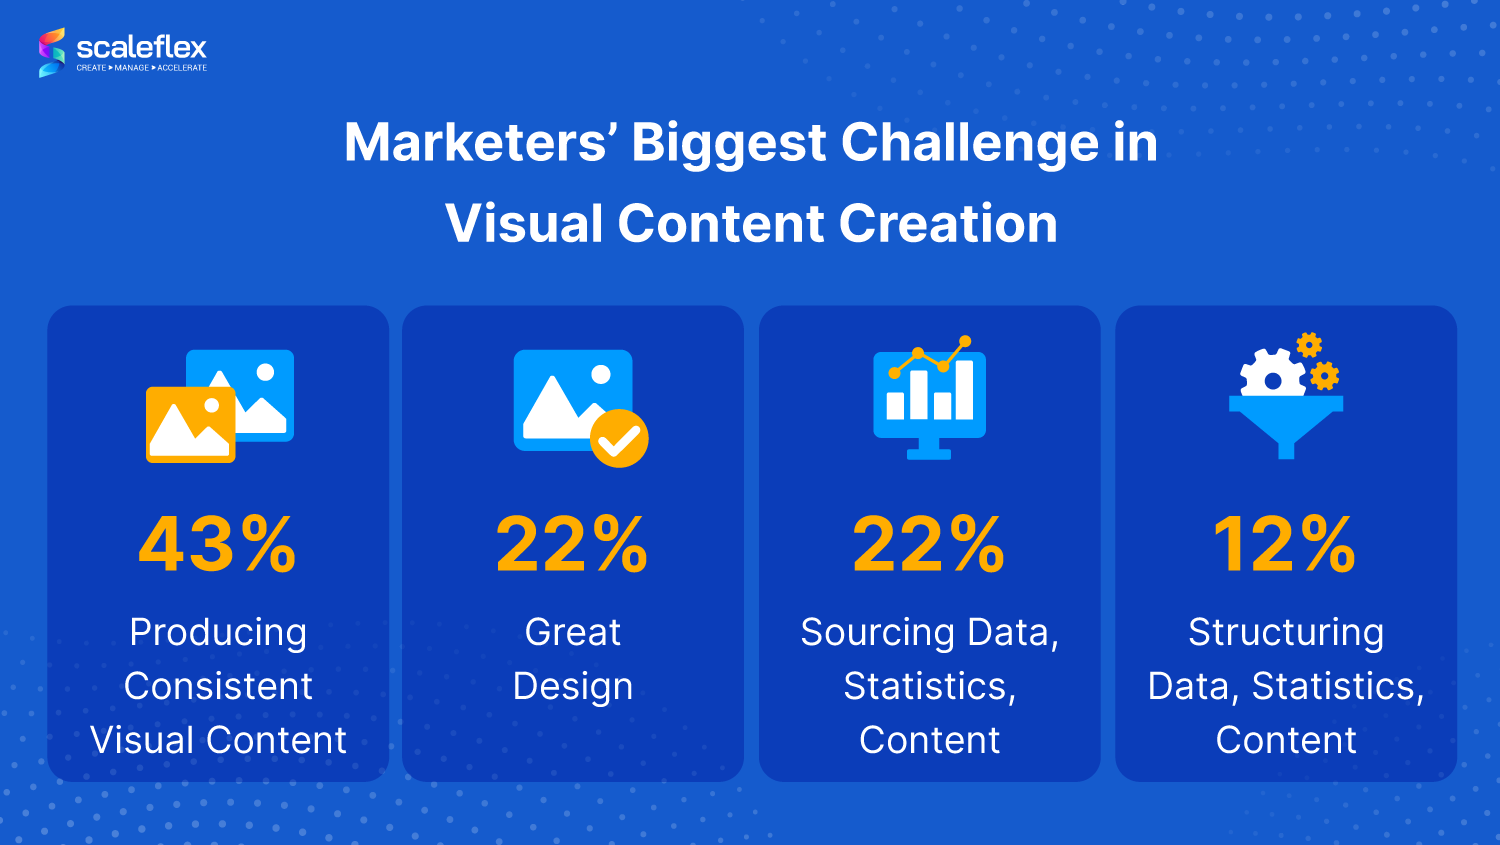
47. 66% of businesses say that videos are too time-consuming to make - Hubspot
Adapting visuals to different platforms and devices
48. 39% of marketers wish to automate the generation of multiple types of designs - Venngage
49. 85% of users on the Internet consume content on multiple devices at the same time - Finances Online
Solutions to solve visual content challenges
Even with the challenges, we’re happy to share that there are solutions to ease marketers' challenges in creating visual content.

Leverage AI & ML to automate manual & repetitive processes
While automation was seen as a good-to-have a decade ago, today, it is fast becoming a must-have for visual content creation.
50. 57% of CMOs use AI for content personalization, while 56% of CMOs use AI for predictive analytics and customer insights - CMO survey
As far as possible, automate time-consuming and repetitive media creation with AI & ML technology! Processes such as cropping it for social media and removing the background for your product images can take a lot of time. Letting technology take care of it can return you that time for more productive endeavors.
Doing so also helps reduce content-to-market processes and make visual content creation fuss-free.
Optimize and Accelerate Images and Videos
While it is important to create visual content, images and videos are often heavy and can slow down your website. Image optimization, video transcoding, and adaptive streaming ensure that your online visitors can appreciate your beautiful content. Add on the use of Content Delivery Networks (CDNs) to bring your content to users worldwide, rocket fast.
Organize and manage digital assets with a powerful DAM
Creating all these media assets also means you will need an innovative, robust, and performant way to store and manage them. Digital Asset Management can help you to organize all your digital assets and foster collaboration within your teams.
Key Takeaways
Data tells so much, and now that you've got all these statistics, what do you do with it?
The moral of the story is that visual content is fast becoming King. To keep up with your competition, you'll have to utilize the entire gamut - photographs, images, infographics and videos.
Keeping updated with the latest channels and platform changes to be one of the first movers is also vital.
The ultimate goal here - is to engage audiences in fresh new ways, get them to know about your brand, recall it, and then convert. The best approach to market your brand is through visual content and managing these digital media assets in the best possible way through powerful technologies such as Scaleflex.
Want to take your visual content marketing to the next level? Speak to our Scaleflex experts today!


